Read your performance report
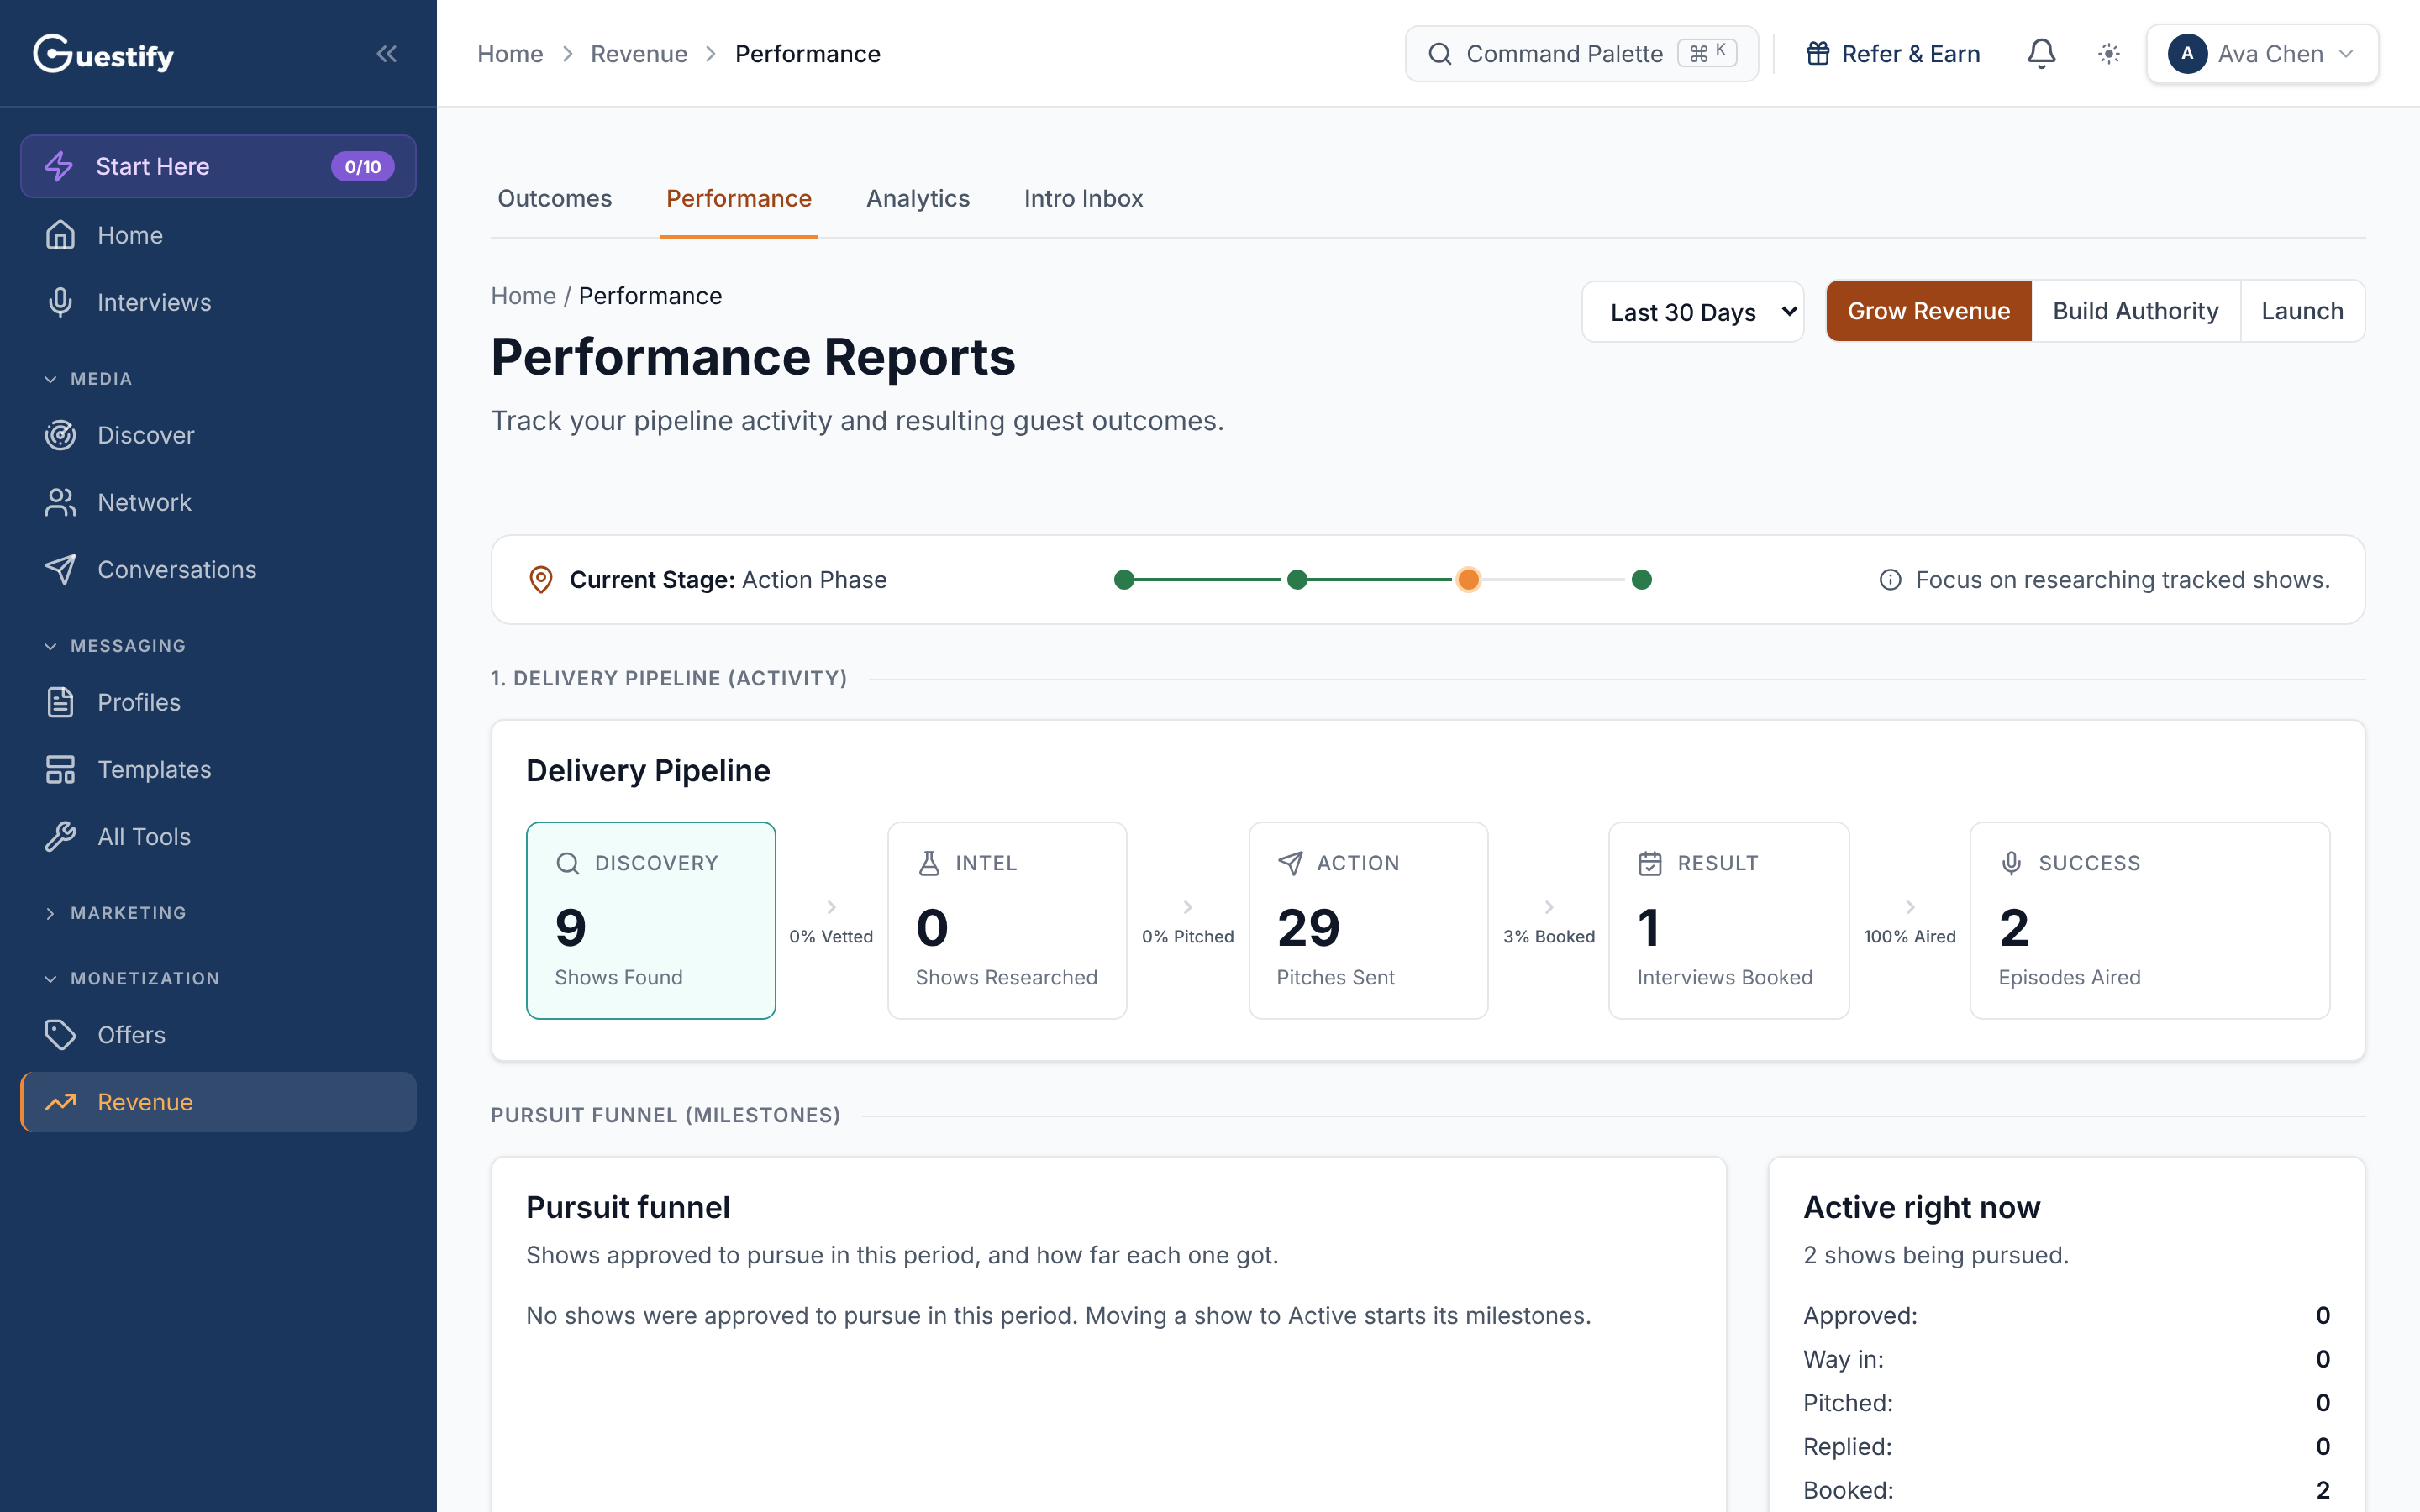
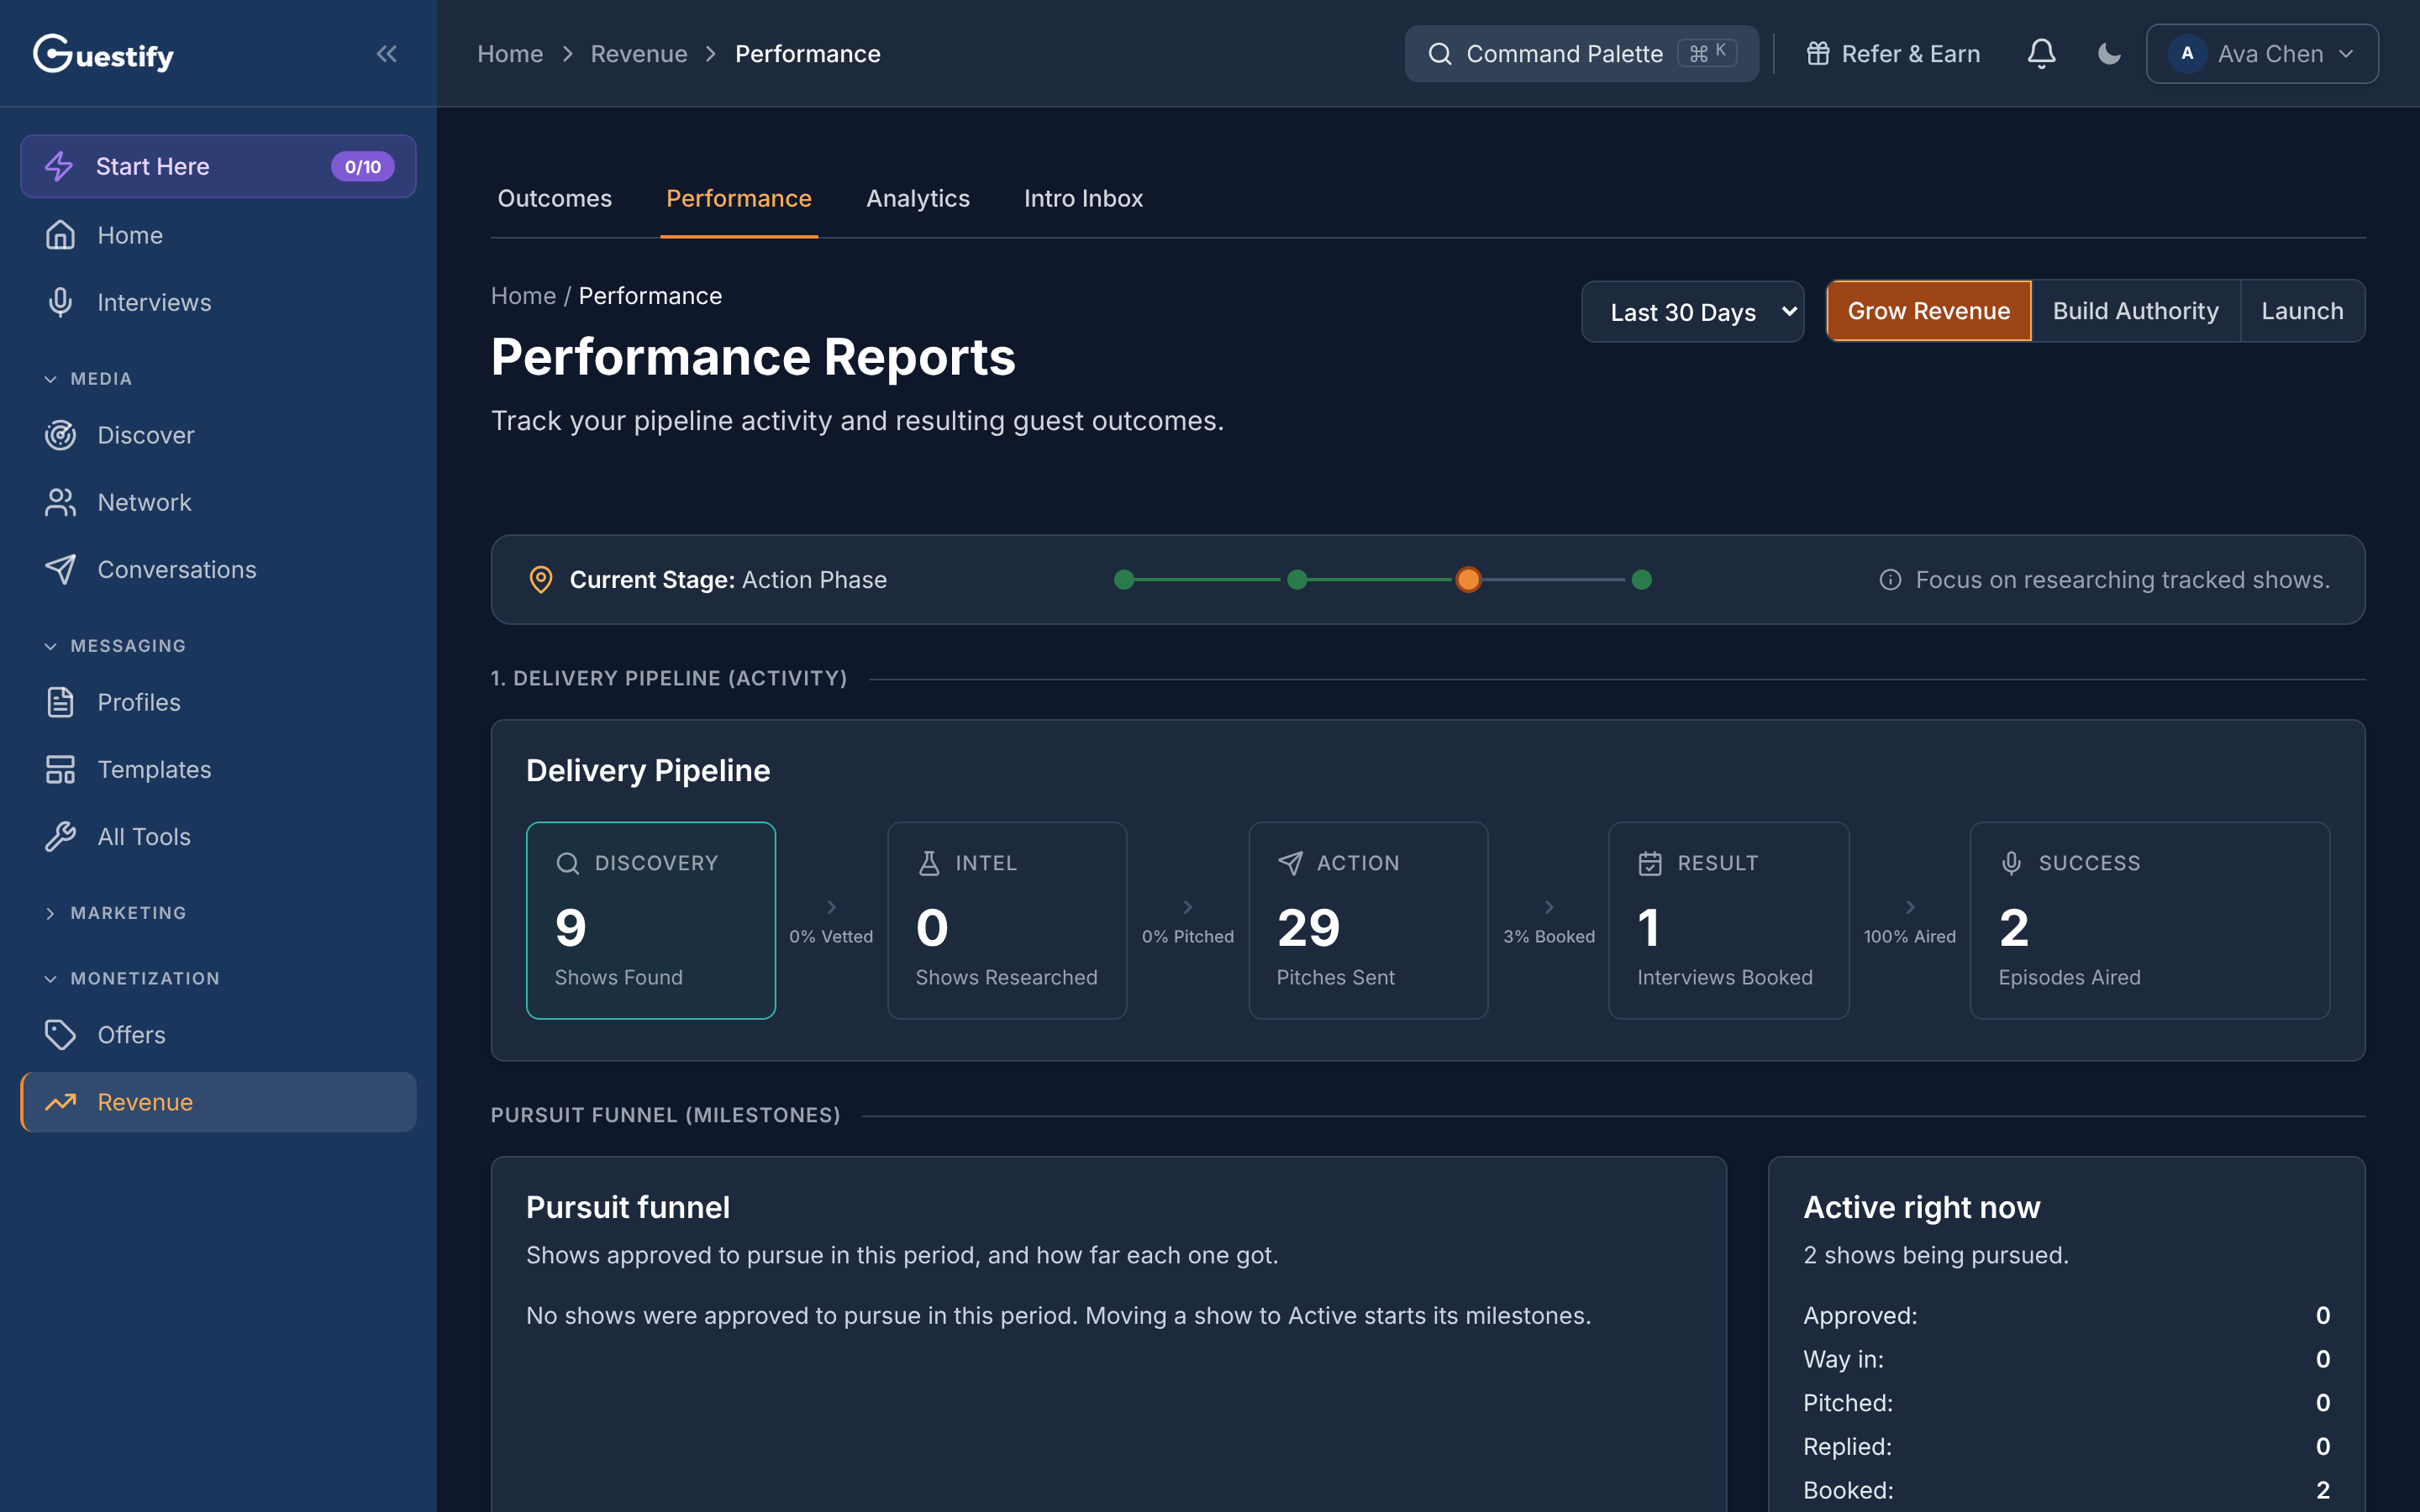
See how many shows you found, researched, pitched, booked and aired in a period, and how far each show you pursued got.
Transcript: Performance Reports in 15 seconds
Performance Reports follows your delivery pipeline from shows found, to researched, pitched, booked and aired, with the conversion rate at each step. Below it, the pursuit funnel tracks the shows you're actively going after.
Click Revenue in the sidebar, under Monetization; it opens on Performance. The page is called Performance Reports.
Choose the period and goal
Pick Last 30 Days, Last 90 Days or Year to Date. The goal buttons (Grow Revenue, Build Authority, Launch) change which results the lower section highlights.
1. Delivery Pipeline (Activity)
Five steps, with the conversion rate between each pair:
| Step | What it counts in the period |
|---|---|
| Shows Found | Shows added to your pipeline |
| Shows Researched | Shows with an AI analysis |
| Pitches Sent | Campaign emails you sent |
| Interviews Booked | Replies you marked Booked interview in Conversations › Replies |
| Episodes Aired | Appearances with the Aired or Convert status, by air date |
So that Interviews Booked stays accurate, mark a reply as a booked interview when a host says yes. See Run outreach.
Pursuit Funnel (Milestones)
The pursuit funnel follows the shows you approved to pursue in the period, and how far each one got: Approved, Reached out, Replied, Booked, Recorded. Beside it are your booking rates, overall and for warm and cold approaches.
Active right now counts the shows currently at each milestone, and how many are Stalled (14 or more days without movement). Open the pipeline board takes you to Interviews › Appearances.
2. Performance Outcomes (Results)
The lower section shows results for the goal you picked, plus Revenue Overview, Revenue by Show and Revenue Attribution. View All opens Revenue › Outcomes, where those results are logged and attributed.